Infographics often perform better than simple text-based blog posts. An infographic is also likely to be read, on average, 30 times more than a traditional blog post. Moreover, infographics can increase a website’s traffic by 12%. But not every infographic will perform that well. You need to be strategic about how you create, design, and promote it. Here are 8 tips to help you design better infographics and get more traffic.
1. Pick an interesting topic that your target audience would find useful
While creating an infographic often seems the most daunting task, picking the right topic is half the battle. Understand that not every infographic gets traction and traffic. You need to have a topic that is focused, interesting, and useful for your target audience. If it is something that your readers are interested in, the infographic is more likely to get the traction and attention you want it to. Instead of going with the more popular topic, pick something that your audience would appreciate and find useful. Identify a problem for a specific group of people and solve it.
2. Make it easy to view
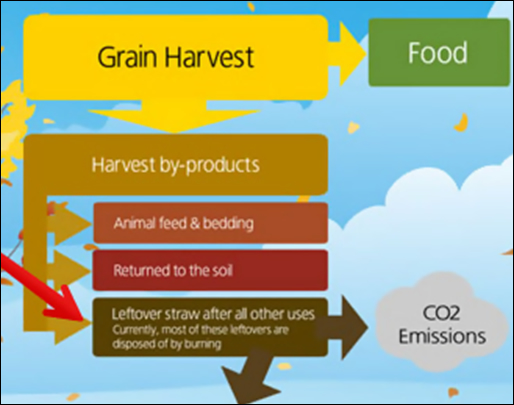
Next comes one of the most important and difficult parts of creating an infographic: its design. The infographic needs to have the right colours combinations. The choice of font and font size also has a lot of impact on its readability. Following is a small part of an infographic. As you can see, there are two major problems with it:
- The font size is too small to be read easily.
- The colour combination is making it even more difficult to read the text.
Apart from the colours, the infographic also must be of an appropriate size. While you may want to go big, you should not overdo it. The infographic should not be more than 8,000 pixels. Besides, you also want it to be of a relatively smaller size for those with poor internet connections. Lastly, make sure to add ample white space. Otherwise, the infographic will become too convoluted. Here is an example of an infographic without sufficient white space.

3. Write an attention-grabbing headline
Next comes the part where you grab your reader’s attention with content and text, and you start with an attention-grabbing headline. Just like an ad or a blog post, the headline of an infographic should hook your readers and encourage them to read further. The headline should be sort, to-the-point, promising, and interesting. 70 characters is a good length. Too long, and you won’t be able to keep their attention. Too short, and you might not put everything in it that you want to.
4. Write a blog post to accompany your infographic
Once your infographic is ready, it is time to publish it. Make sure to write a small blog post to accompany your infographic. Remember that you are trying to simplify a complex topic with your infographic. Having accompanying text will help you achieve that purpose more efficiently. Moreover, a keyword-rich blog post may also help your infographic in the search engine results pages (SERPs). With more opportunity to include relevant keywords, you give yourself a better chance to rank higher in the SERPs.
5. Use every social channel you have
This goes without saying, but you must always use all the social channels you have to promote your infographics. Infographics are more likely to go viral. Therefore, make sure to use every social channel and relevant forum when promoting an infographic.
6. Reach out to influencers
If you believe your infographic solves a major problem and is clearly superior to other infographics in your niche, you should reach out to influencers who might find it interesting. Niche influencers are always looking for good content to share with their audience. One tweet from them can help your infographic gain a lot of virality and traffic.
7. Submission to different infographic websites
There are several infographic websites that you can submit your infographic to. These websites include: Visual.ly, Visualistan, Killer Infographic, Daily Infographic, etc. Many popular publications use these infographic sites to find interesting and useful infographics for their content. If your infographic gets picked, it may help increase your authority, credibility, and ranking in the SERPs.
8. Guest blogging
Lastly, do not forget to re-purpose your infographic and use it for guest posts. By linking back to the original article and your website, you can gain targeted traffic and valuable back links. Another technique is to create a different accompanying blog post and use that to pitch your infographic. New, exclusive content is always preferred in the guest blogging world.